Central Pacific Edition
Sound Advice
Is There an Echo in Here?

The amazing images we are seeing from the ocean floor are derived from echoes of sound bouncing off the undersea terrain and returning to our sonar. Making sense of this information depends critically on the speed of sound in the water. This varies quite a bit depending on conditions, so the REMUS is equipped with a CTD (Conductivity- Temperature-Depth) sensor that is used to calculate sound speed. Although we are only interested in the speed near the bottom, the sensor operates as soon as it hits the water and so will give us measurements all the way down. We took the opportunity to look at this “sound velocity profile” to see what it might tell us.
Under standard lab conditions, sound travels about 1,560 meters per second in seawater (much faster than the 340 meters per second in air). That’s just about a mile per second. But it varies quite a bit as the elasticity* of the water changes in response to changes in temperature, depth, and to a lesser extent, salinity. The biggest effect is temperature, which has a very complicated influence on elasticity due the the unique structure of the H2O molecule. With most fluids, sound speed decreases with temperature, but with water it actually increases by about 3 m/sec for every 1 °C increase. Sound speed also increases with depth (because the pressure increases and changes elasticity) by about 1.7 m/sec for every 100 m change in depth.
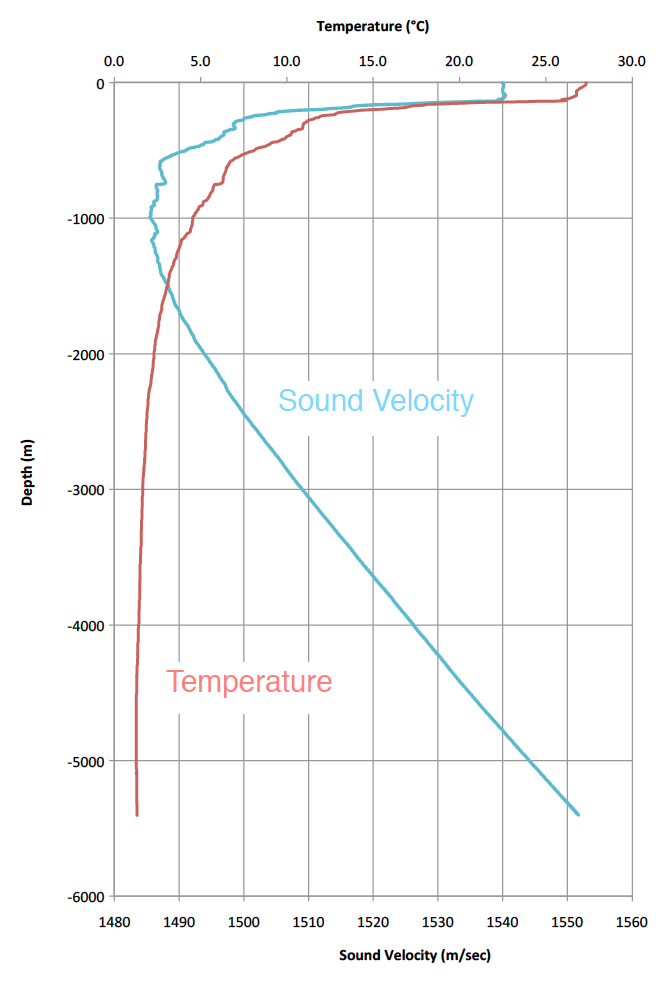
The plot on this page shows how the measured temperature and calculated sound velocity changed as the REMUS descended to the depths on one of its missions. This is a classic profile. The temperature at the surface was a balmy 27.5°C (82°F), but dropped sharply to about 5°C just 1,000 m down. By the time REMUS reached 5,500 m it was a bone chilling 1.3°C, just above freezing. Influenced by the temperature, the sound velocity dropped sharply down to the first 1,000 m. At that point, the relentless increase in pressure with depth took over as the temperature stabilized, and the sound velocity rose back to and above its surface value. (Salinity effects were also calculated but were small.) The sound speed changed by more than 4% over this range.
Besides its effect on the sidescan sonar, changes in sound velocity cause the paths sounds travel to vary, much like a lens alters the path of light. As a wave of sound passes through the water, some parts of the wavefront move faster than others causing the sound to bend away from areas of higher velocity. A particular consequence of this can be seen if we look at the shallower (first 200 m depth) of this plot. Mixing of surface water warmed during the day to deeper regions, and subsequent cooling at night, will typically cause an “isothermal” (constant temperature) layer near the surface, or even a temperature “inversion,” where it gets warmer as one goes deeper, to a point. This can occur in tropical waters thanks to intense solar heating and strong wave action. Below that layer, the temperature will drop as described earlier. This thermal layer can cause large variations in sound wave propagation. Submariners take advantage of this as a submarine lurking just below the layer can be “hidden” from sonars listening at the surface, since its sounds will bend to greater depths. On the other hand, a ship on the surface may escape the attention of the submarine below the layer since its sounds may remain confined to shallower regions. In some cases, the sound can be trapped in a “surface duct” and propagate for many miles horizontally, while making not a whisper below the layer.